![]() |
|
|||||||
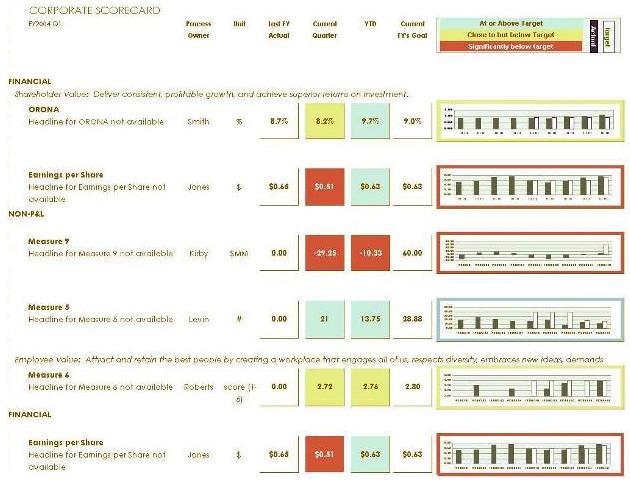
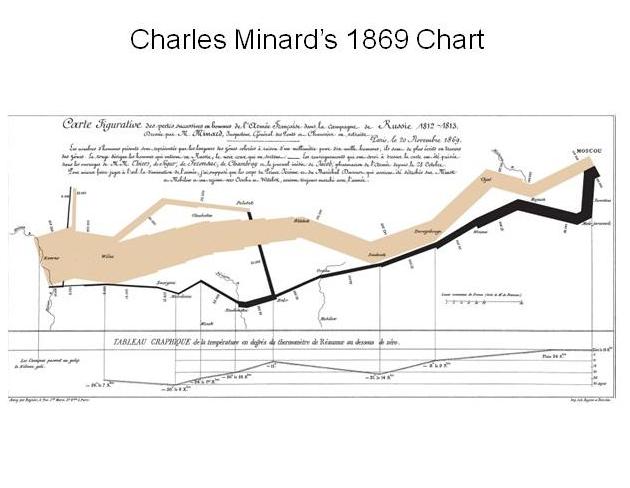
A GUIDE TO VISUAL ANALYTICS FOR ECONOMISTS NABE Webcast, June 17, 2009, moderated by Michael Warner, Quantum4D |
||||||||
![]() |
||||||||
| Introduction | How we see information today | How we presented it traditionally | Migrating to new presentation form | |||||
|
![]() |
|
||||||
| Scorecard Example | Mapping: The Good and the Bad | Heat Maps and Glyphs | ...and Beyond | |||||
| Download EXCEL Scorecard File | See also: Gapminder | |||||||
| Download Powerpoint Slides | Robert Yerex' Tufte Style Example | Anne Klieve: Pivot Table Example | Go To: Last Slide | |||||
| Download Powerpoint PDF | ||||||||
| Download Powerpoint Notes | ||||||||
| RESOURCES: WINK: Download free software to create shockwave files, e.g., from animated PowerPoin Presentations |
RESOURCES: 
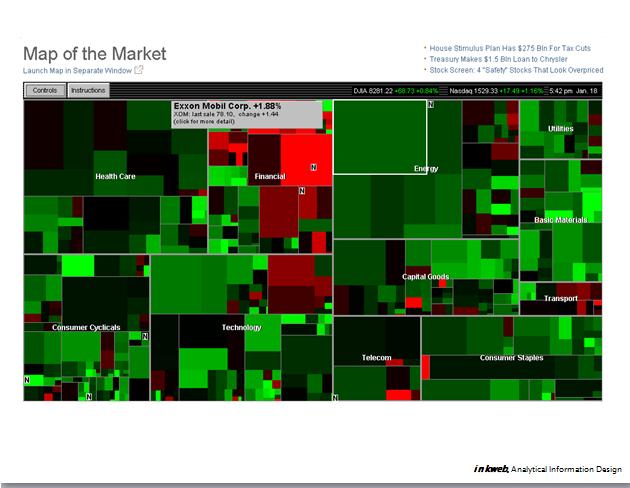
TREEMAP: Download free software for space-constrained visualization of hierarchical structures |
RESOURCES: 
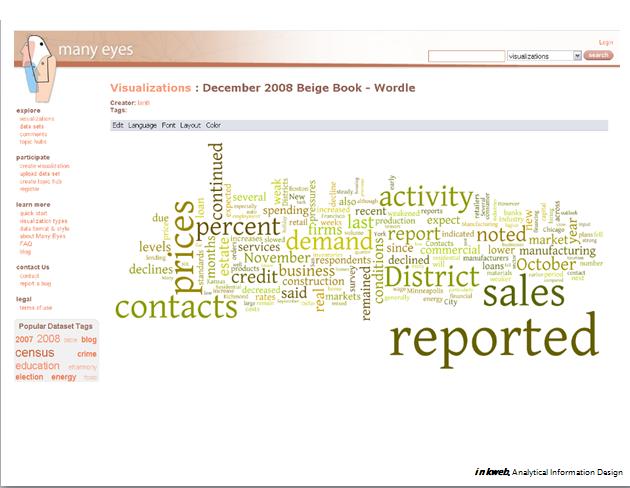
IBM ManyEyes Site: Social networking for data visualization |
OTHER
RESOURCES: There are numerous links to information on Visual Analytics on inkweb's Resource page |
|||||
| |
||||||||
| |
|
|||||||
| |
|
|||||||