|
 |
 next slide |


| Smart
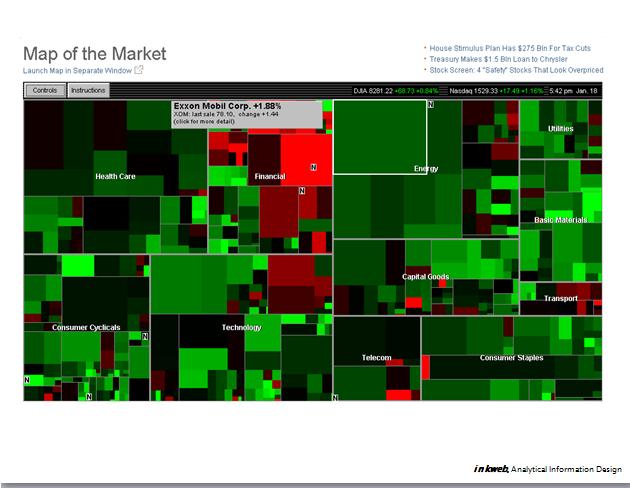
Money: Map of the Market Mark Wattenberg designed the Map of the Market while at SmartMoney.com. The goal was to give a quick answer to the question, "what's happening in the market?" Treemaps: "Treemaps display hierarchical (tree-structured) data as a set of nested rectangles. Each branch of the tree is given a rectangle, which is then tiled with smaller rectangles representing sub-branches. A leaf node's rectangle has an area proportional to a specified dimension on the data. (In the illustration, this is proportional to a waiting time). Often the leaf nodes are colored to show a separate dimension of the data. When the
color and size dimensions are correlated in some way with the tree structure,
one can often easily see patterns that would be difficult to spot in
other ways. A second advantage of treemaps is that, by construction,
they make efficient use of space. As a result, they can legibly display
thousands of items on the screen simultaneously."
(Wikipedia) |
NOTES