prev slide
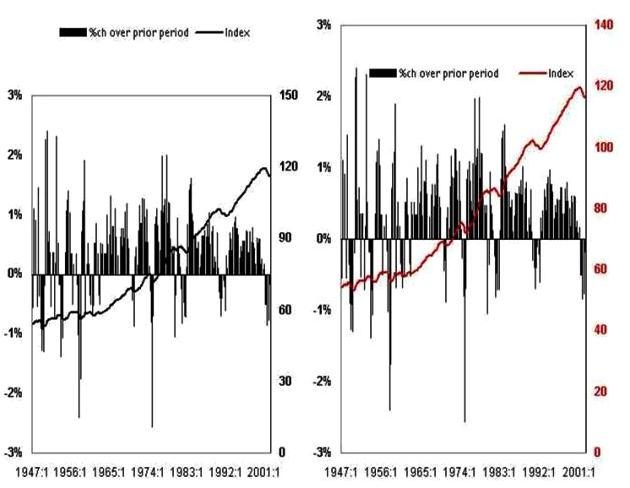
Minimize Mapping & Maximize Visual Cues Place descriptive information as close as possible to the data it describes Color code scales with the data series which use them – here the index and right hand scale are in red.